
The “days on market” statistic tells you about the real estate activity. The days on market (DOM) indicates the length of time a specific house is on the market before it sells. It will vary from town to town, neighborhood to neighborhood and from one price point to another. Knowing the DOM can help you pick your strategy for pricing a house you're selling, or how quickly and aggressively buyers should be when making an offer.
Researching Days on Market
Manipulating this number might have worked in the past but not any longer with sites like Zillow and Trulia. Here's an example from Zillow, showing one of the houses I looked at in July of 2014. The price you offer for a house on the market more than a year, is going to be lower than the price you would offer for a house on the market for less than a month.
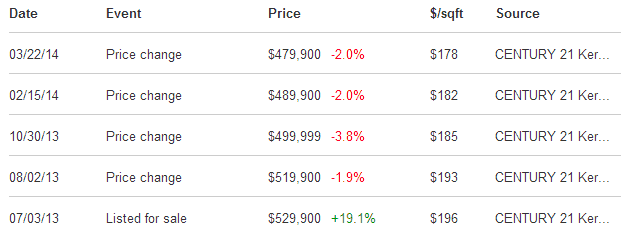 So on July 2, 2014 … the house above had 365 days on market (DOM). But there are similar terms that can get confusing like the “average days on market” or ADOM.
- Average Days on Market (ADOM) – is confusing because you can look at the average DOM of homes sold in 3, 6 or 12 months and find their average, but what does it mean?
- Absorption Rate – is a better indicator of market conditions, looking at supply and demand. It's calculated by dividing the current number of active listings by the average sales per month for the prior 12 months. The industry says 6.5 months of inventory indicates a balanced market.
- Buyer's Market – exists when there is excess inventory on the market, or more than 6.5 months of houses available for sale. This gives buyer's more negotiating leverage because seller's have more competition for too few buyers.
- Seller's Market – occurs when there are fewer than 6.5 months of inventory listed. When the absorption rate gets low, buyers will find themselves in bidding wars with people offering more than the asking price.
To learn a bit more about how DOM information can be misleading, here's an article from Just Real Estate Talk.


